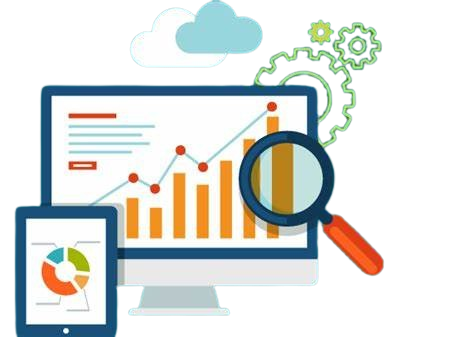
Data analytics is the process of examining raw data to uncover insights, trends, and patterns that can aid in decision-making and problem-solving. It involves applying statistical and mathematical techniques to large datasets to extract meaningful information and actionable conclusions.
Data analytics encompasses various methodologies, including descriptive, diagnostic, predictive, and prescriptive analytics,
UKCTL has great expertise in the field of data analytics and has done several data analytics work for several organisations assisting them in effective decision making. Proven to be competent in using the following tools
Python
MySQL/Big Query/Post-Gre SQL
Tableau and Excel
Microsoft Power BI
Hypothesis Testing
Product Analytics and Statistics
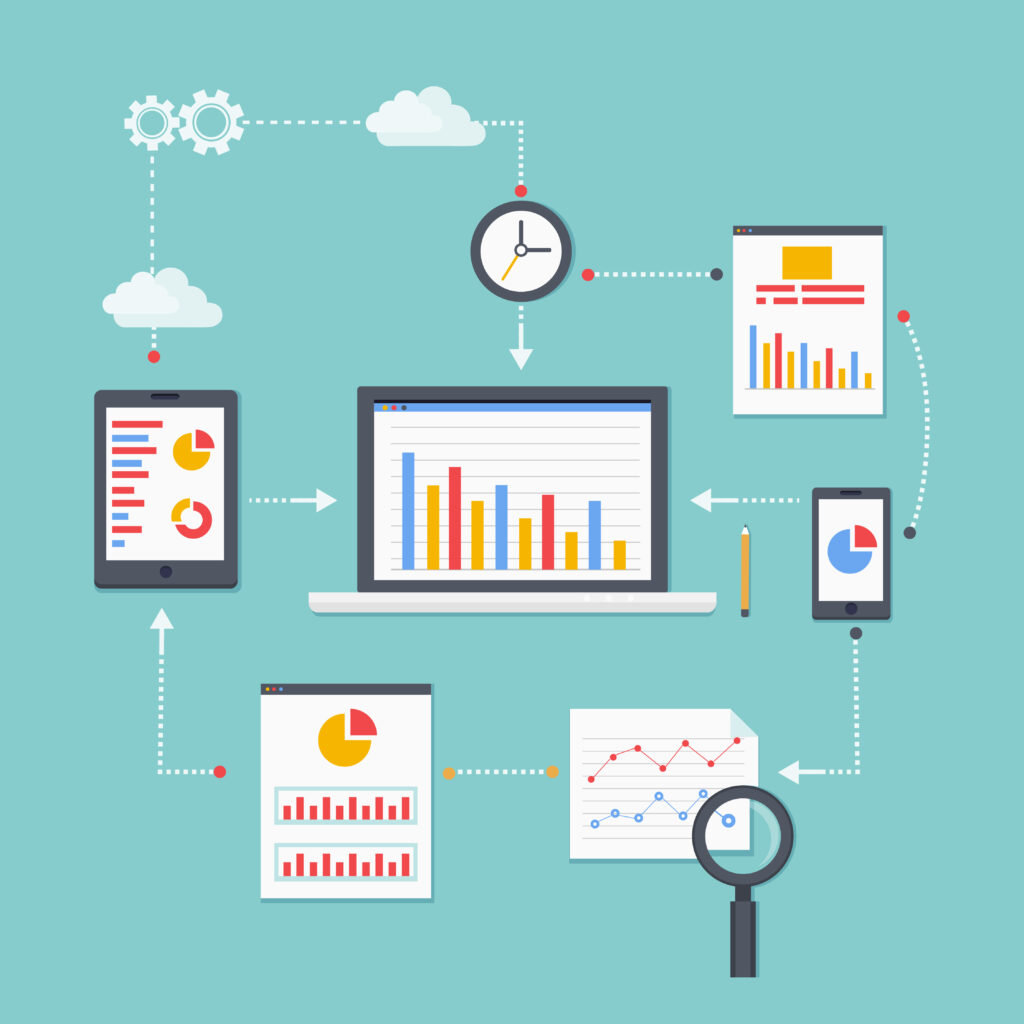
The general steps involved in data analytics typically include:
Define Objectives:
Determine the specific goals and objectives of the data analysis project. What questions are you trying to answer? What problems are you trying to solve?
Data Collection:
Gather relevant data from various sources, such as databases, spreadsheets, APIs, or external datasets. Ensure data quality and integrity by cleaning and preprocessing the data as needed.
Data Exploration:
Explore the dataset to gain a better understanding of its characteristics, including its size, structure, and patterns. Use descriptive statistics, data visualization techniques, and exploratory data analysis to identify trends, outliers, and relationships within the data.
Data Preparation:
Prepare the data for analysis by transforming and formatting it into a suitable format. This may involve tasks such as feature engineering, data normalization, encoding categorical variables, and handling missing values.
Data Analysis:
Apply various analytical techniques and algorithms to extract insights and patterns from the data. This could include statistical analysis, machine learning algorithms, or other advanced analytical methods, depending on the objectives of the analysis.
Interpretation and Insights:
Interpret the results of the analysis in the context of the original objectives. Identify key findings, trends, correlations, and actionable insights that can inform decision-making or address the problem at hand.
Visualization and Reporting:
Communicate the results of the analysis effectively through data visualizations, reports, and presentations. Use charts, graphs, dashboards, and other visualization tools to present findings in a clear and understandable manner to stakeholders.
Validation and Iteration:
Validate the results of the analysis to ensure accuracy and reliability. Iterate on the analysis as needed, refining methodologies, adjusting parameters, or incorporating feedback to improve the quality of the insights generated.
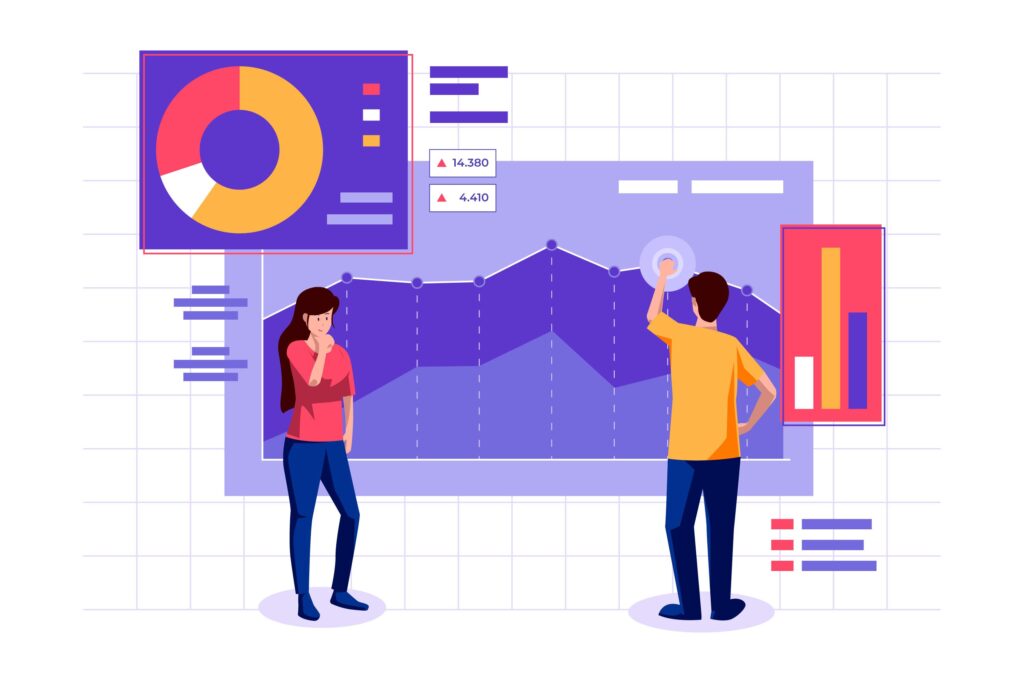
Product Analytics:
Product analytics refers to the process of collecting, analyzing, and interpreting data related to a product or service. It involves examining user interactions, behaviors, and performance metrics to gain insights into how users engage with the product, identify areas for improvement, and make data-driven decisions to enhance its overall effectiveness and user satisfaction.
Statistics Hypothesis testing:
Hypothesis testing in statistics is a method used to make inferences about a population based on sample data. It involves formulating a hypothesis about the population parameter, collecting data, and using statistical techniques to assess the likelihood of observing the sample results if the null hypothesis were true.